
For anyone new to investing, one of the most significant barriers to entry is what shares to pick. There are over 2,000 shares on the FTSE, 2,800 companies on the NYSE, and over 3,600 on the NASDAQ. And that’s just the biggest exchanges! Shares trade worldwide, including Canada, Germany, Australia, Hong Kong, India, and many other countries. How do you know which stocks to invest in and which to avoid? Simply Wall St aims to answer that question by providing users with quality research and guidance. As we’ll see in this Simply Wall St review, they’re mostly quite successful!
Simply Wall St Review: What Does This Company Offer?
Simply Wall St is a fintech platform from Australia, and it aims to be the premier place for people to track stocks and visualise data. It’s a research platform where people can learn more about the 150,000-ish stocks that it covers worldwide.
If you have looked into stocks before and done some research, you may be wondering why this platform is attracting so much attention. After all, there are quite literally thousands of sites online that let people research stocks. Any brokerage or share dealer you sign up with, for example, will likely have a section where you can explore shares, get historical stock prices, and view expert opinions.

14 day free trial
Receive a 14-day free trial and unlimited company views so you can experience the platform’s full functionality for an extended period of time, when you use our link.
Therefore, to be different in this space is challenging. However, Simply Wall St achieves its differentiation through two key factors: accessibility and quantity.
Thousands of platforms indeed offer ways to research stocks; however, very few of them are as easy-to-use and accessible to an ordinary investor as Simply Wall St. The layouts, visualisations, and concepts are easy to understand even for more novice investors. Indeed, pulling this off is often hard to do, considering the complex nature of investing.
Secondly, to have analysis data for as many stocks as Simply Wall St has is quite impressive. For any share you want to know more info about, all you need to do is load up Simply Wall St and voila, you’ll have the information you need! It truly is handy to have a one-stop shop for all analysis information. This point becomes especially true if you use multiple brokers or have trading accounts in multiple jurisdictions. For example, if you have a Fidelity account in the US and a Hargreaves Lansdown account in the UK, having Simply Wall St be your central, standardised research platform is helpful, rather than flipping back and forth between the two brokerages.
Bottom-line: Simply Wall St offers a nicely-designed, comprehensive research platform that is truly useful for everyone.
What Data Is Available on Simply Wall St?
The success of any research platform depends on its data. After all, you can design a site to be as lovely as you want, but if it doesn’t have the data you need, it won’t be of much help. Fortunately, Simply Wall St does include a substantial amount of data – most of which will be pretty beneficial in helping you make your investment decisions.
When you select a stock on the platform, you will see nine sections available to you:
- Company Overview
- Valuation
- Future Growth
- Past Performance
- Financial Health
- Dividend
- Management
- Ownership
- Other Information
After reviewing each of these sections, you would have an incredibly detailed picture of how any particular company is doing.
To give you an idea of what to expect if you register with Simply Wall St, here’s an overview of what you can expect to see in perhaps the three most exciting sections: Company Overview, Valuation, and Future Growth.
Company Overview
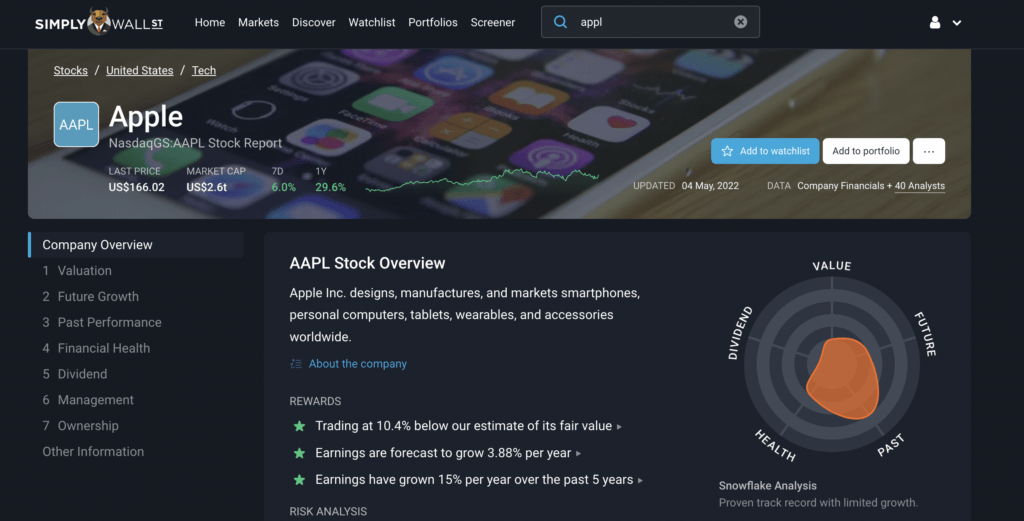
The company overview tab is a high-level overview of the stock and its potential opportunities and pitfalls. You’ll see the name of the stock, the current prices, the market cap, and a description. That’s all essential information you can get anywhere. However, you’ll also see a few other things about the company that are useful to see “at-a-glance.”
In particular, you’ll see potential reward and risk factors. For example, a “reward” might be that analysts project earnings to grow by 25% this year. A risk might be that the company has diluted shareholders in the past year. You’ll also see a Snowflake Analysis which looks at basic company information and checks it against some basic metrics (e.g., is the dividend reliable and stable) and then produces a nice little graphic to let users know if the stock passes these checks. If it does, the graph is greener. If it doesn’t, you’ll see red. There are some additional data points, like competitors, all on this page.
Ultimately, the company overview page is beneficial. It provides a high-level overview of the stock and should give potential investors a good idea of whether it’s a good investment, even just by looking at this page alone!
Valuation
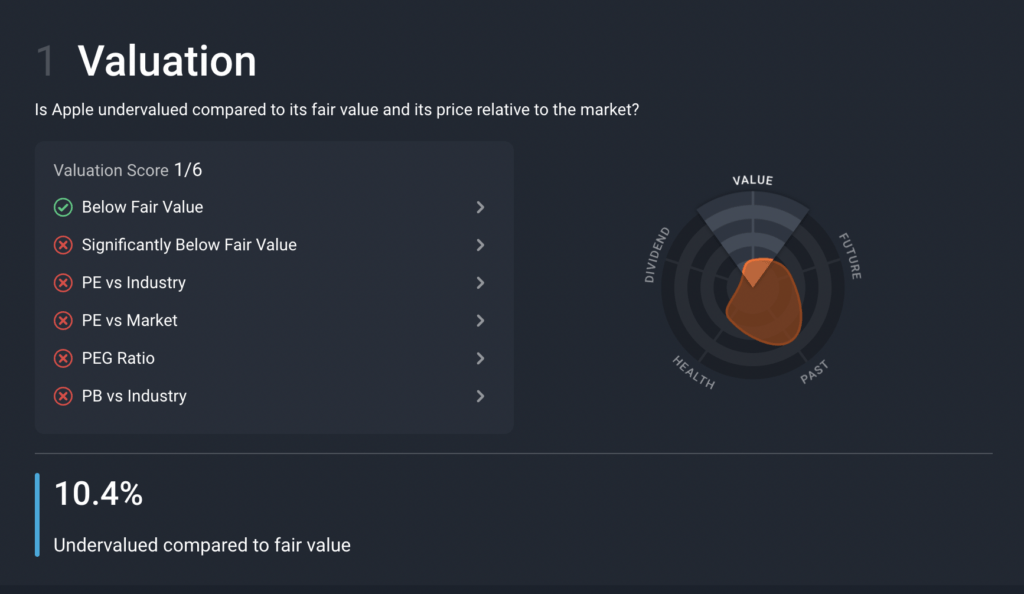
Valuation is a handy tab that uses discounted cash flow analysis to calculate the fair market value of a stock (for more information on this method, please see this article).
Essentially, it takes what analysts predict the cash flow to be in future quarters to create an intrinsic value for a stock. It’s a popular method to develop an expected stock price and ascertain whether the current price is too high or if it is a good buy right now as the price is low.
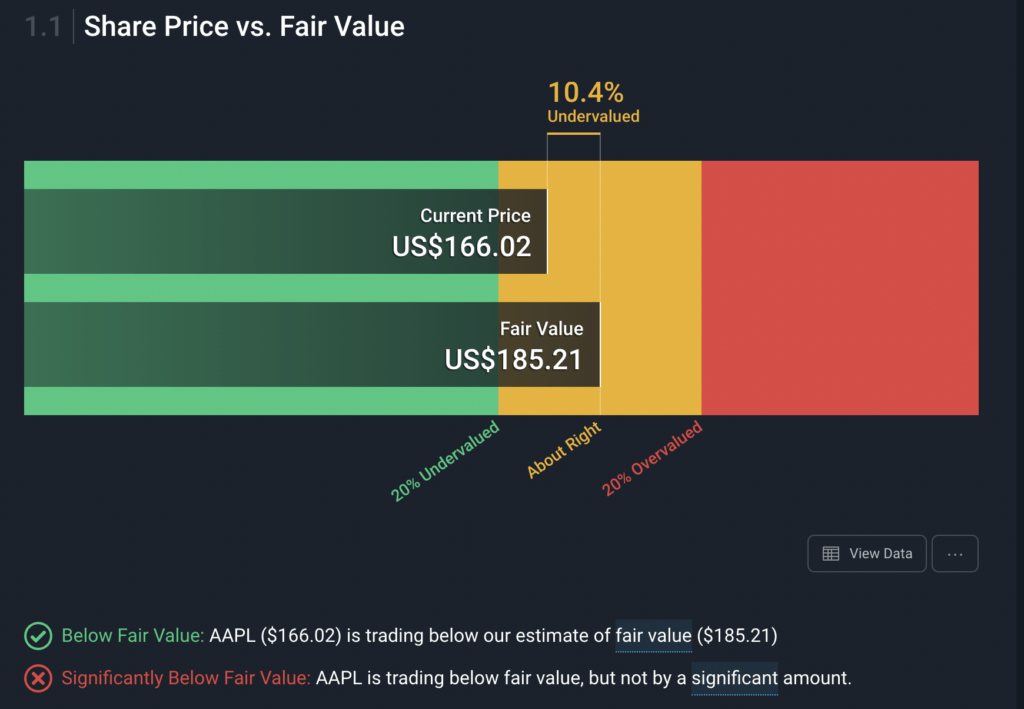
You will then see a graph indicating the current price and the fair value, including what would be 20% undervalued and 20% overvalued. If the current price is more than 20% undervalued, that would presumably be a smart buy. Conversely, if it’s 20% overvalued, that might be a signal to sell.
It’s an elegant tool that takes a complex formula for arriving at a valuation and distils it into an excellent graphic that anyone can follow!
Future Growth
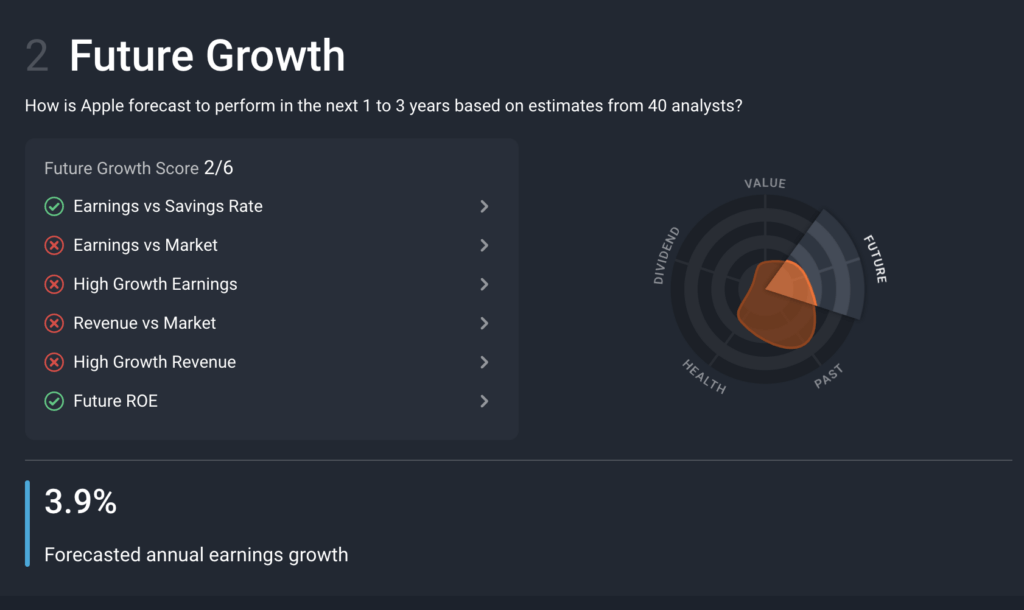
Future growth is another powerful section because it helps investors understand the expected trajectory of a company in the future. A healthy company should continue to grow on a sustainable course.
Much like the overview section, the future growth section has a nice intro that checks growth in six key areas:
- Earnings vs Savings Rate
- Earnings vs Market
- High Growth Earnings
- Revenue vs Market
- High Growth Revenue
- Future ROE
The system checks each of these metrics and shows a little green checkbox if the company passes or a red “x” beside if it doesn’t. The more green checkboxes you see, the healthier the future growth prospects are. You can also click the arrow beside each row to learn more about the metric and see why Simply Wall St concluded what it did.
Further down the page, you’ll see valuable data like future growth forecasts, projected earnings, etc.
Indeed, between the overview, valuation, and future growth sections, you should have an excellent idea of what any company is, what its growth prospects look like, and if it is currently fairly valued!
Simply Wall St Review: What Else Is Available?
Simply Wall St is primarily a data research platform; however, that’s not all you’ll find on the site. One of the other excellent features is the portfolio builder.
With the portfolio builder, you can create a new portfolio and have Simply Wall St analyse the entire basket of stocks instead of just looking at one individually. So, instead of looking at Shell, Ford, and Tesla individually, you can see the combined effect of owning them together. That is, is the valuation of all these stocks good? What are the future growth prospects for all the shares you have?
Since most people tend to build portfolios with multiple stocks, this feature is handy. You can see how your selection of, say, ten companies will do in aggregate instead of just looking at each share individually!
Pricing and Availability
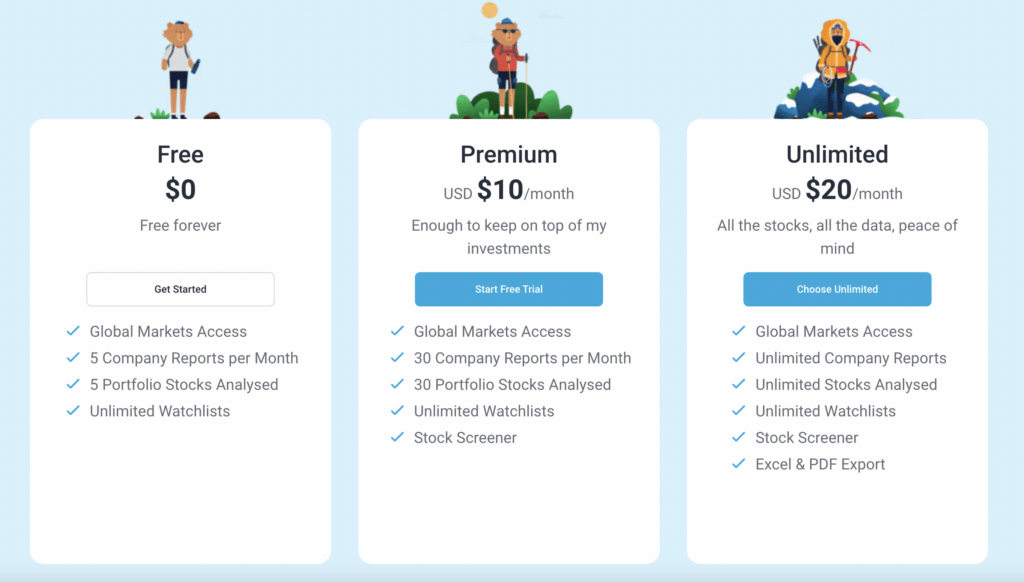
Simply Wall St has three plans – a free tier, a premium tier, and an unlimited tier. The difference between each tier is the number of reports you can access per month.
The free tier only lets you analyse five company reports and five portfolio stocks. The premium tier boosts that to 30 reports and 30 portfolio stocks. Lastly, as the name suggests, the unlimited tier lets you get as many reports and do as many analyses as you want!
Two other differences are that the Stock Screener feature is only available for premium and up. Additionally, the unlimited tier has Excel and PDF export support.
Unlimited costs $30 a month, but if you pay annually, you can reduce that to an effective cost of $20 per month ($240 per year). Premium costs $15 per month, but annual subscribers can get it for $120 per year.
It’s not entirely cheap, but, especially if you pay for the unlimited plan annually, you’re getting pretty robust data that could make you a lot more than $20 a month in the long run!
Simply Wall St Review: The Best Research Data Makes a Huge Difference
Having quality data to make investment decisions is essential. Without the correct data, you have no clue if a company is good or if it’s one to avoid. As we can see from this Simply Wall St review, this company provides that data in one of the easiest-to-understand ways ever. With a few clicks of your mouse button, you’ll be able to tell whether or not a company will likely be a good investment.
As noted above, at $20 a month for the highest plan, it’s not exactly cheap, but if you’re investing your retirement funds, paying that cost could significantly improve your ROI, which would be worth it in the end. At least sign up for the free tier to check a few of the stocks you have now! Take a look at some of the data and portfolio analyses available. If you find you need more, you can always upgrade later!
It’s a platform well worth trying, at least!
14 day free trial
Receive a 14-day free trial and unlimited company views so you can experience the platform’s full functionality for an extended period of time, when you use our link.